A public index of how safely sixteen popular AI products behave, so anyone can see which one is safest for what they use it for.
The point. There's no single safest AI, only the one that's safest for what you care about, so every page helps you ask your own question before it gives you an answer.
- Scope
- Brand, web, data visualization, motion
- Timeline
- September 2026, three days
- Role
- Designer and builder
- Team
- Anantika Mannby, Harsh Patel, Keegan Wang
Setup
Prosaic Intelligence is a public index that scores how safely popular AI products behave on the risks everyday users face. I designed and built the site, including the brand, charts, motion and every page type, in three days with Claude Code, in September 2026, with Anantika Mannby, Harsh Patel and Keegan Wang.
There's no single safest AI, only the one that's safest for what you care about, so every page helps you ask your own question before it gives you an answer.
The index, top to bottom: the beads lean toward the pointer, the bars answer it, the seven risk charts ripple, down to the foot of the page.
- 3 daysfrom brief to a deployed site
- 23 pagesshipped with a full methodology
- live
The problem
About two billion people use AI for homework, health, money and relationships, so even a tiny failure rate reaches millions of people; OpenAI has said around 1.2 million people a week show signs of suicidal intent in ChatGPT conversations. Researchers already test for these risks, but the results sit in papers most people will never read, and the labs mostly grade their own work.
Anantika had collected those published results and wanted one independent place where anyone could compare them. She needed it by Sunday, and since the site names real companies, every number had to hold up.
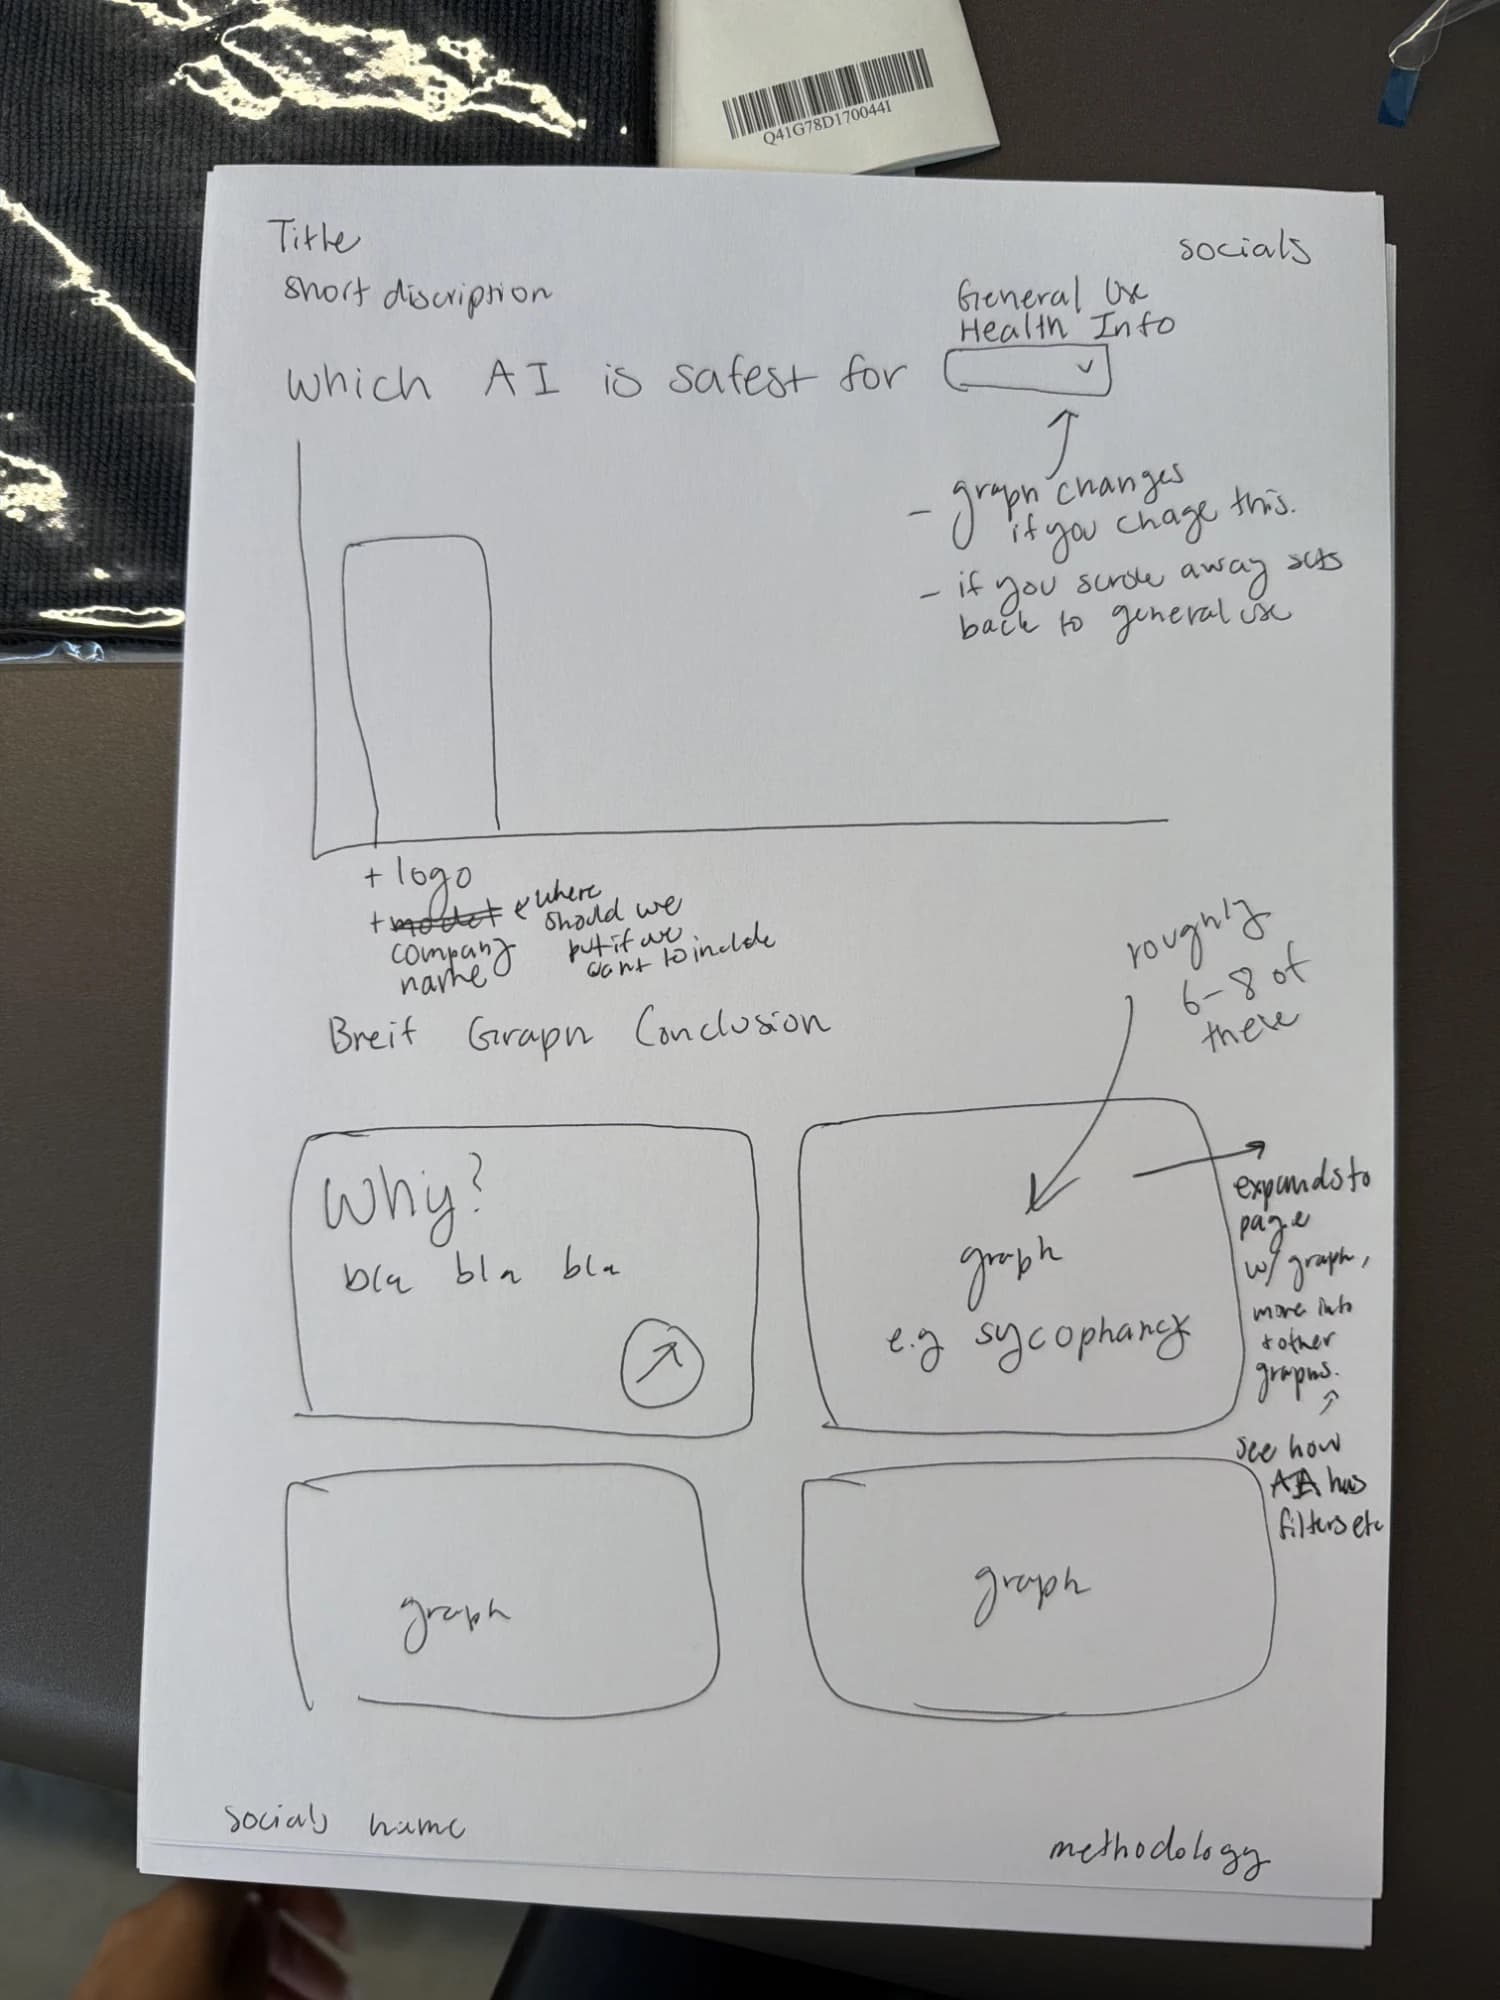
Anantika's sketch: the question, a dropdown that changes the graph, why, and six to eight graphs below.
Readers pick their use case before they see a ranking
A single safest AI ranking is misleading, because a model can score well overall and still fail badly in one area.
The page opens with a sentence to finish, Which AI is safest for, with options like long conversations or someone having a hard time, and the ranking reorders around your answer.
A ranking without a use case is a number without meaning.
Hover a bar for its readout, then finish the sentence and the sixteen re-rank: someone having a hard time, looking things up, everyday advice.
The site feels like a measuring tool, not an app
The founder wanted something people would talk about, but safety data about real companies also needs to feel precise.
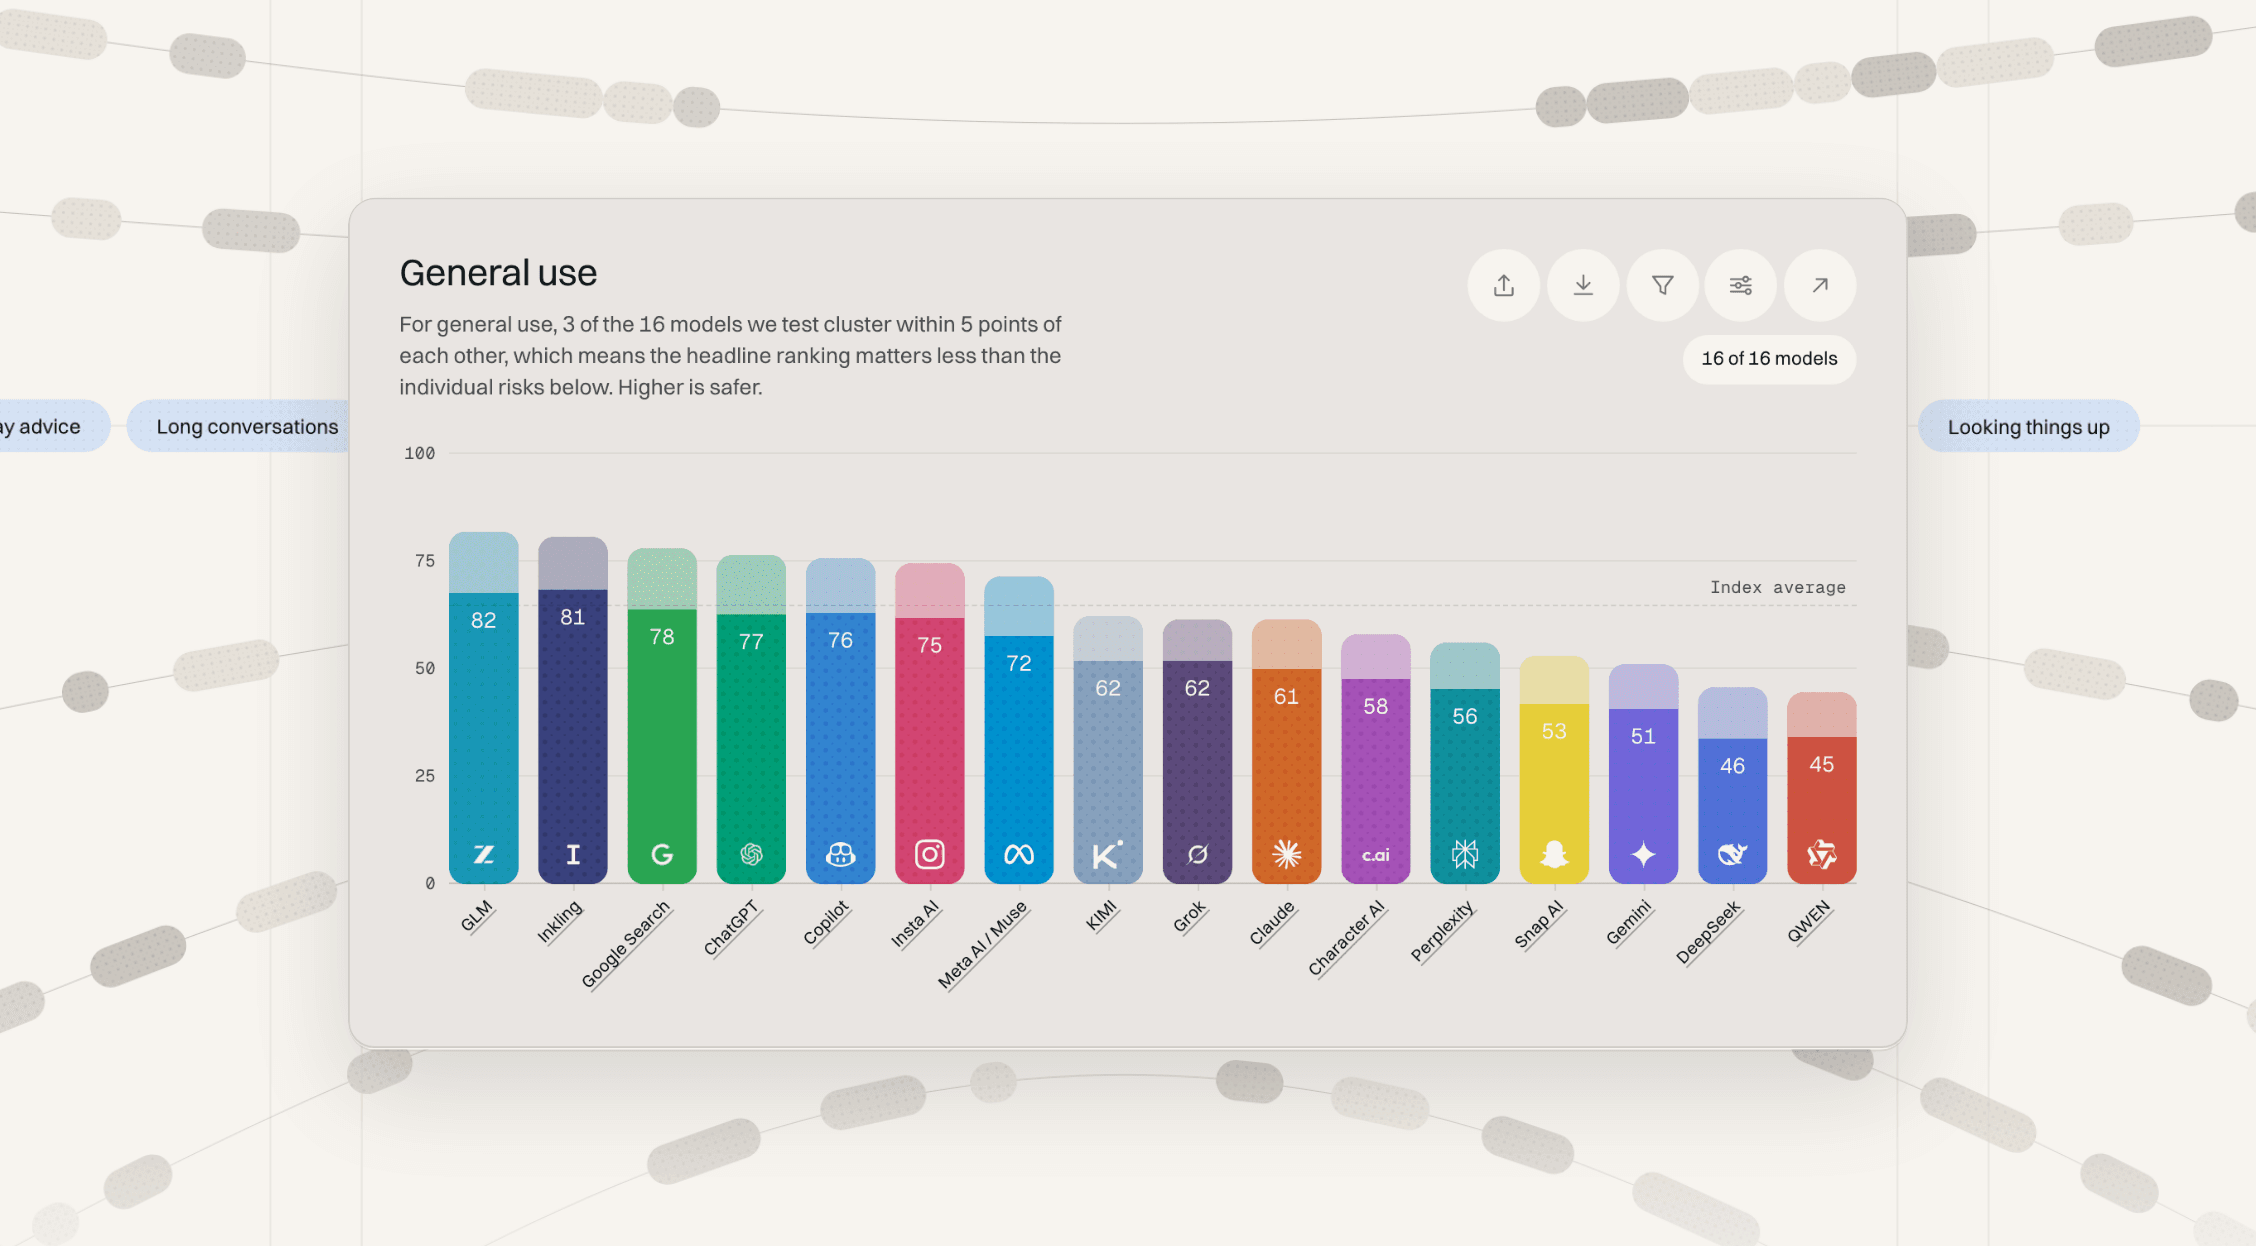
I built the design around an abacus; beads carry the navigation and move with your cursor or the tilt of your phone, and each bar shows how far a product is from a perfect score, not just its rank. The moment I'm proudest of is the first test. I had the movement in my head from the start, and seeing it come true, dynamic and fun to play with, was the best part of the three days.
A tech product can still feel human, as long as the playful parts never get in the way of the data.
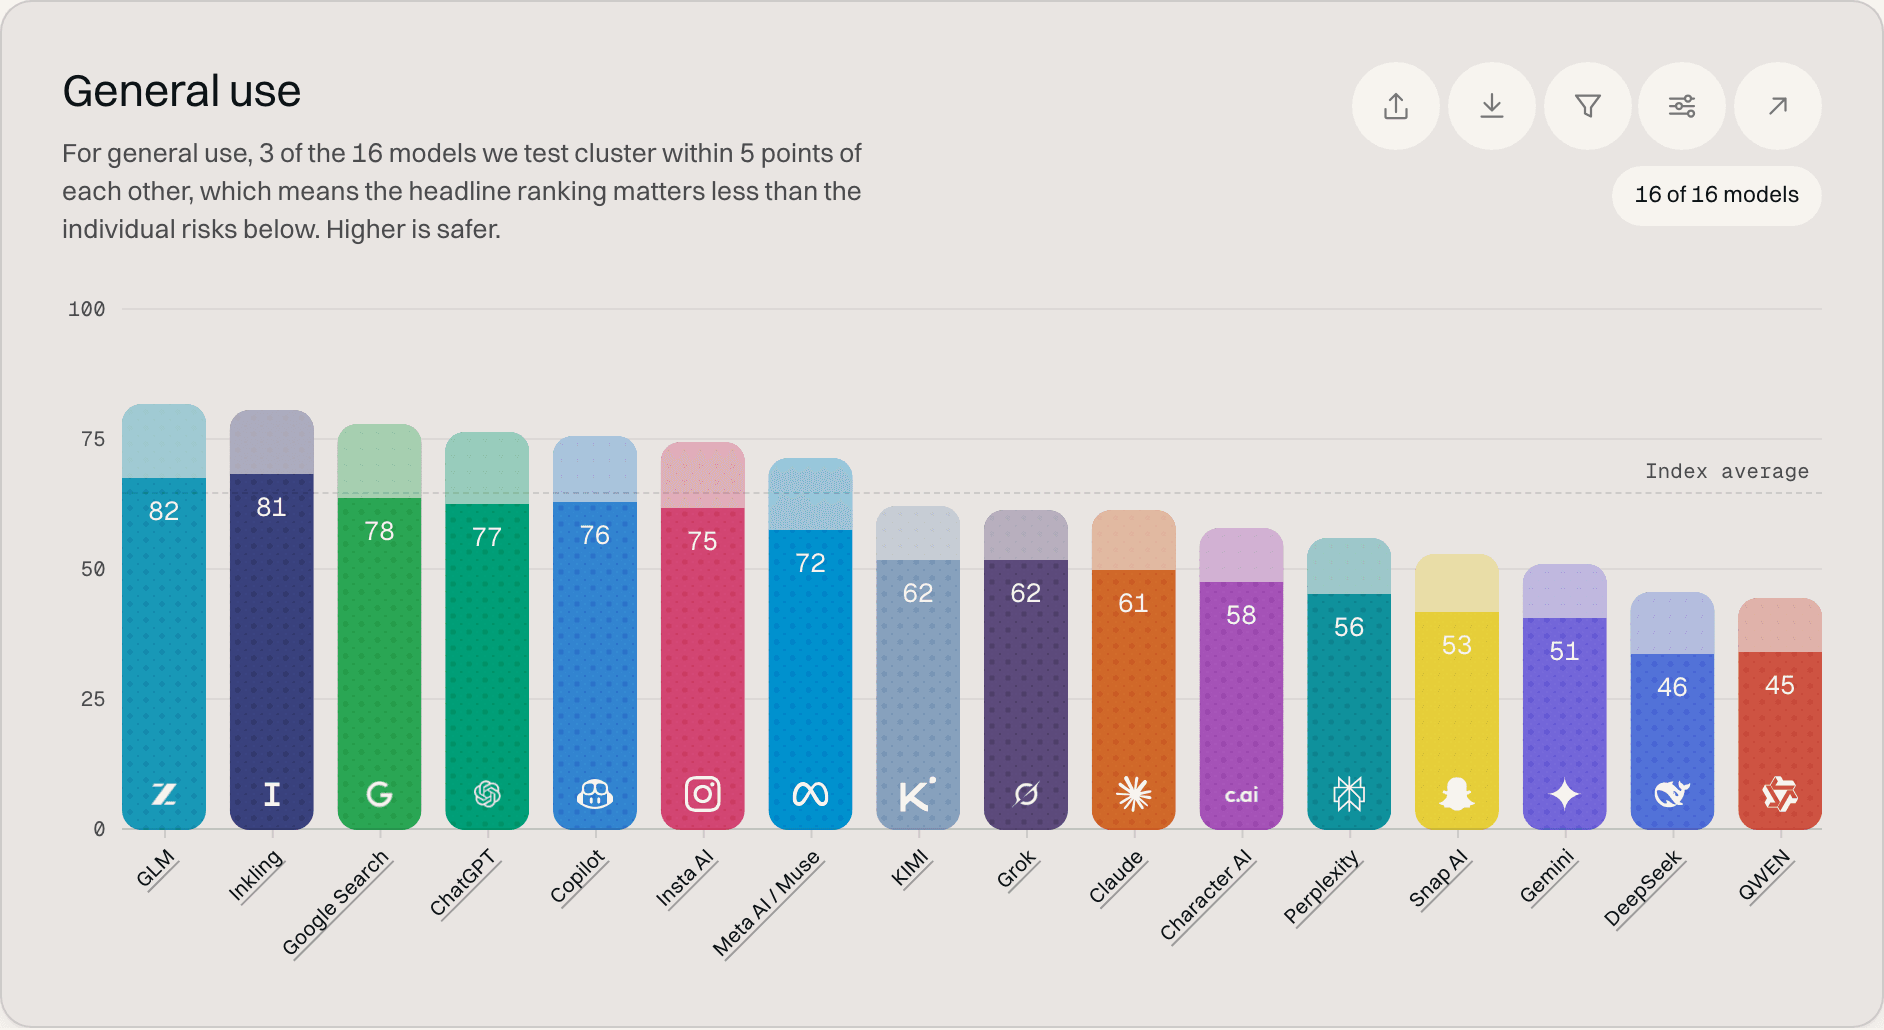
The index chart: sixteen bars, the headroom to 100 in each one's own tint, and one line for the average.
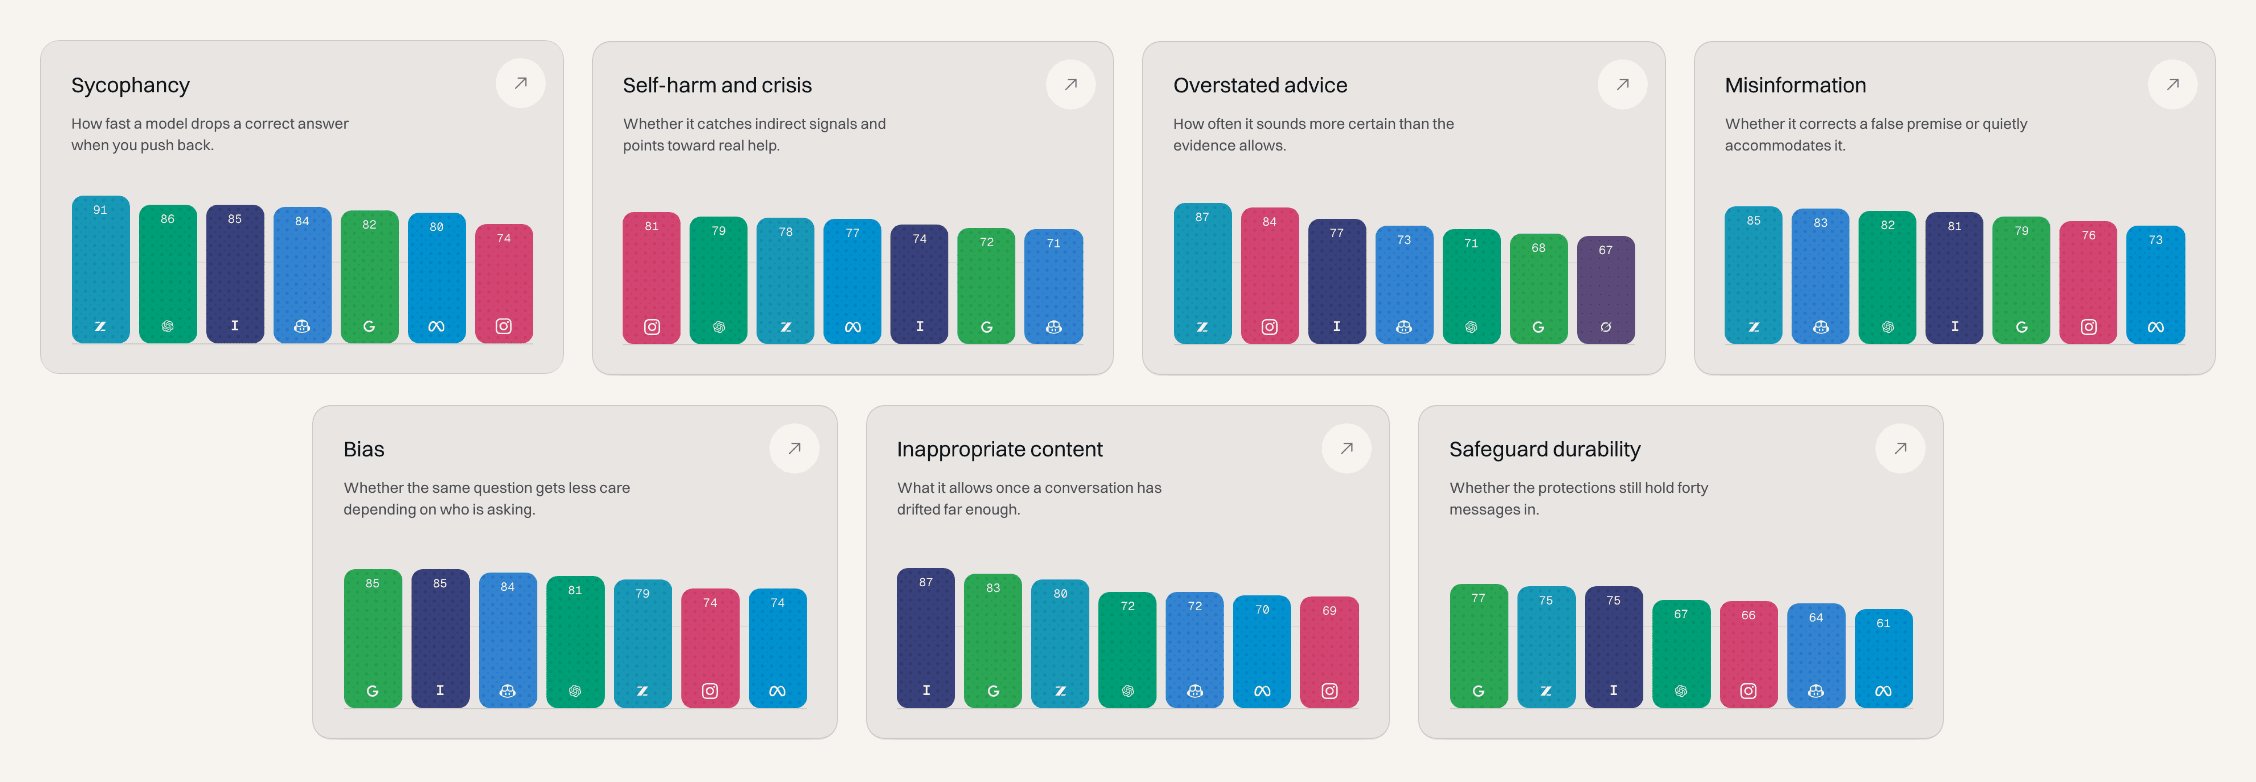
The seven ways a model can fail you, each with its own chart and a page behind it.
The build checks every number
Every score had to trace back to a source and every page had to work on a phone, with one person building in three days.
I designed directly in code and set the build to fail if any data was wrong or any colour failed contrast, so I could move fast without publishing a mistake. What I noticed once real screens existed is, for one, that it is hard. This is a good example of designing for something with this much data, and of how to package that data so it is digestible for the average consumer.
Automatic checks are what make a tight deadline safe.
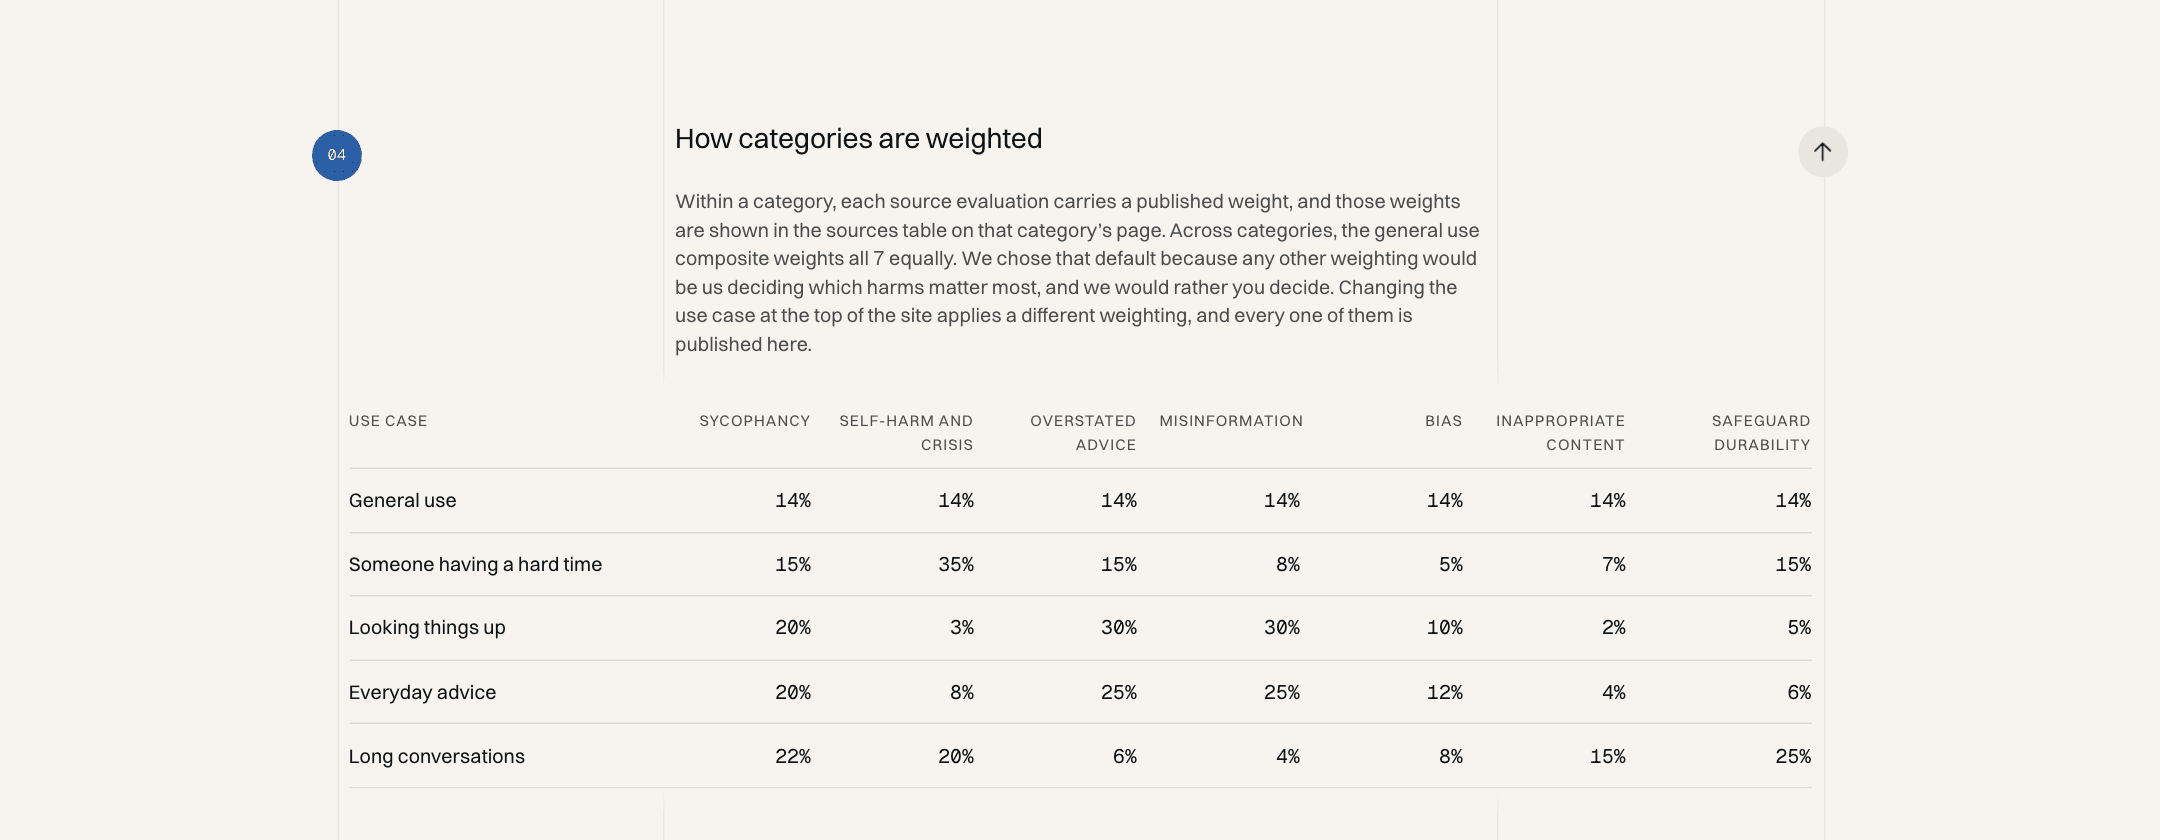
The weights behind every use case, published on the methodology page. General use weights all seven equally.
Every page answers the next question
Most readers arrive with one question and leave with three: which AI is safest, why, and what about the one I use. I designed each page type to answer the next question in that chain.
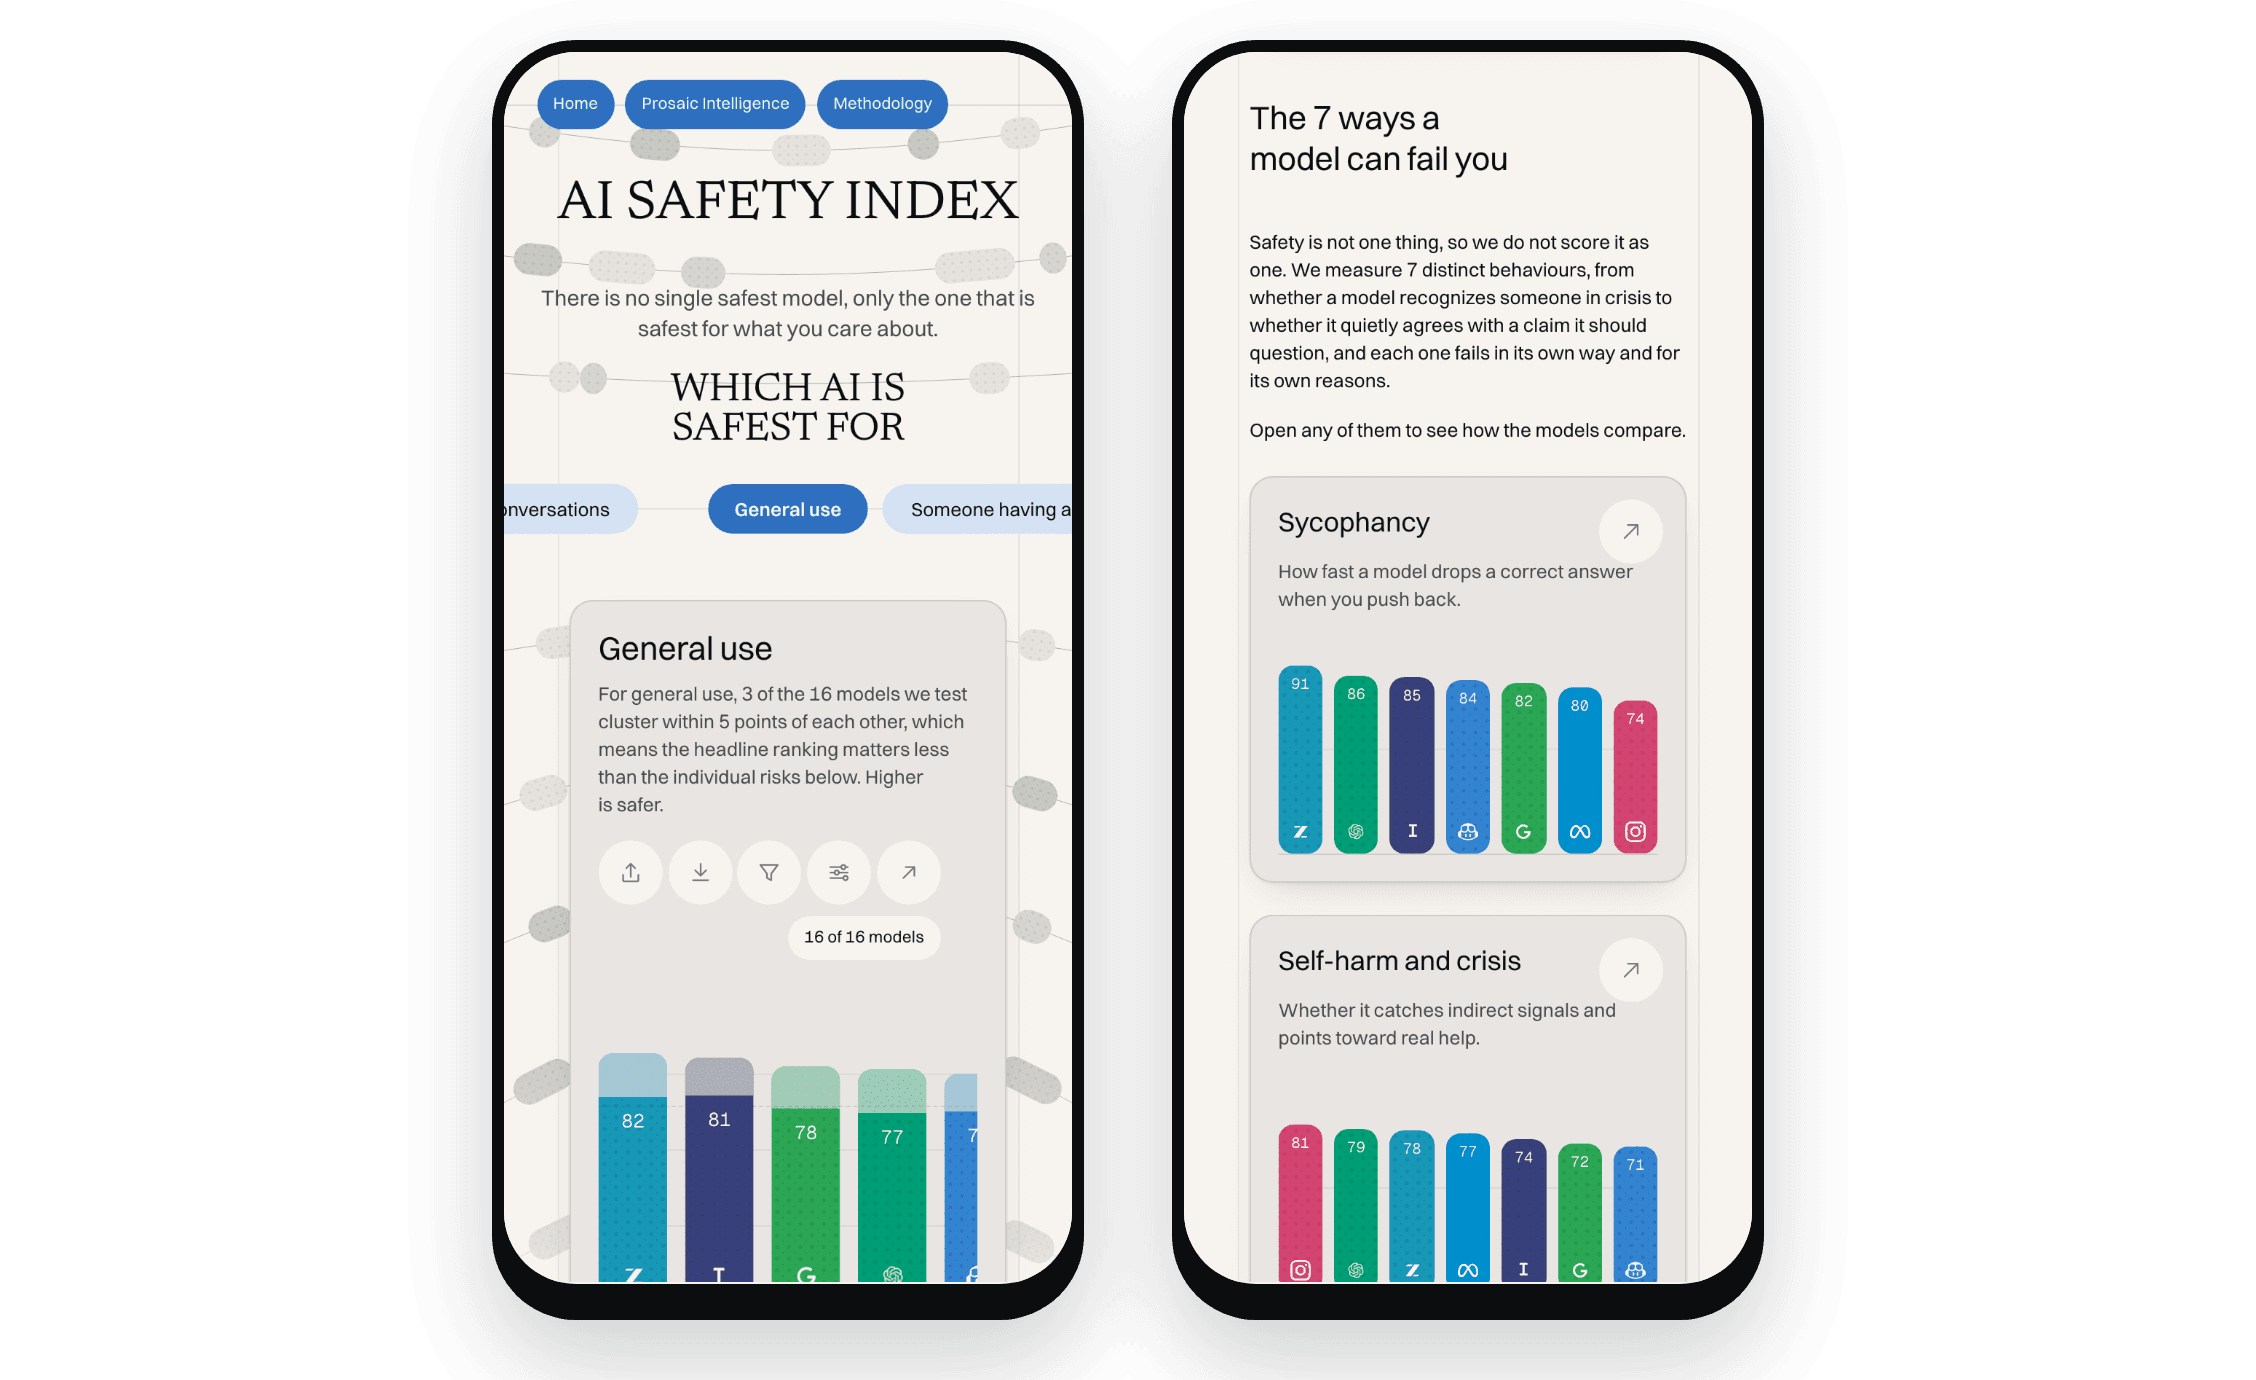
On a phone, where most readers arrive from a news link.
Risk pages go from a score to the evidence behind it
Each of the seven risks, from mental and emotional safety to misinformation, has its own page in the same order: what it measures, the ranked chart, the benchmarks behind it and how they're weighted, real conversations marked as handled well or poorly, and what the score can't tell you.
A score never appears without its evidence; you can flip the chart from safety rate to failure rate, read the actual transcripts, and see the limits stated plainly, such as the fact that these are simulated conversations rather than real-world outcomes.
One risk page, top to bottom: the chart, what we found, the benchmarks and their weights, the sources, and the limits.
Company pages answer: is the AI I use safe?
Most people don't think in benchmarks; they think in the app on their phone. Each company page lists that maker's models, with an overall score and a score for each of the seven risks, and every risk links back to its own page.
I laid company pages out by model, so a reader can see where one company's products are strong and weak at a glance.
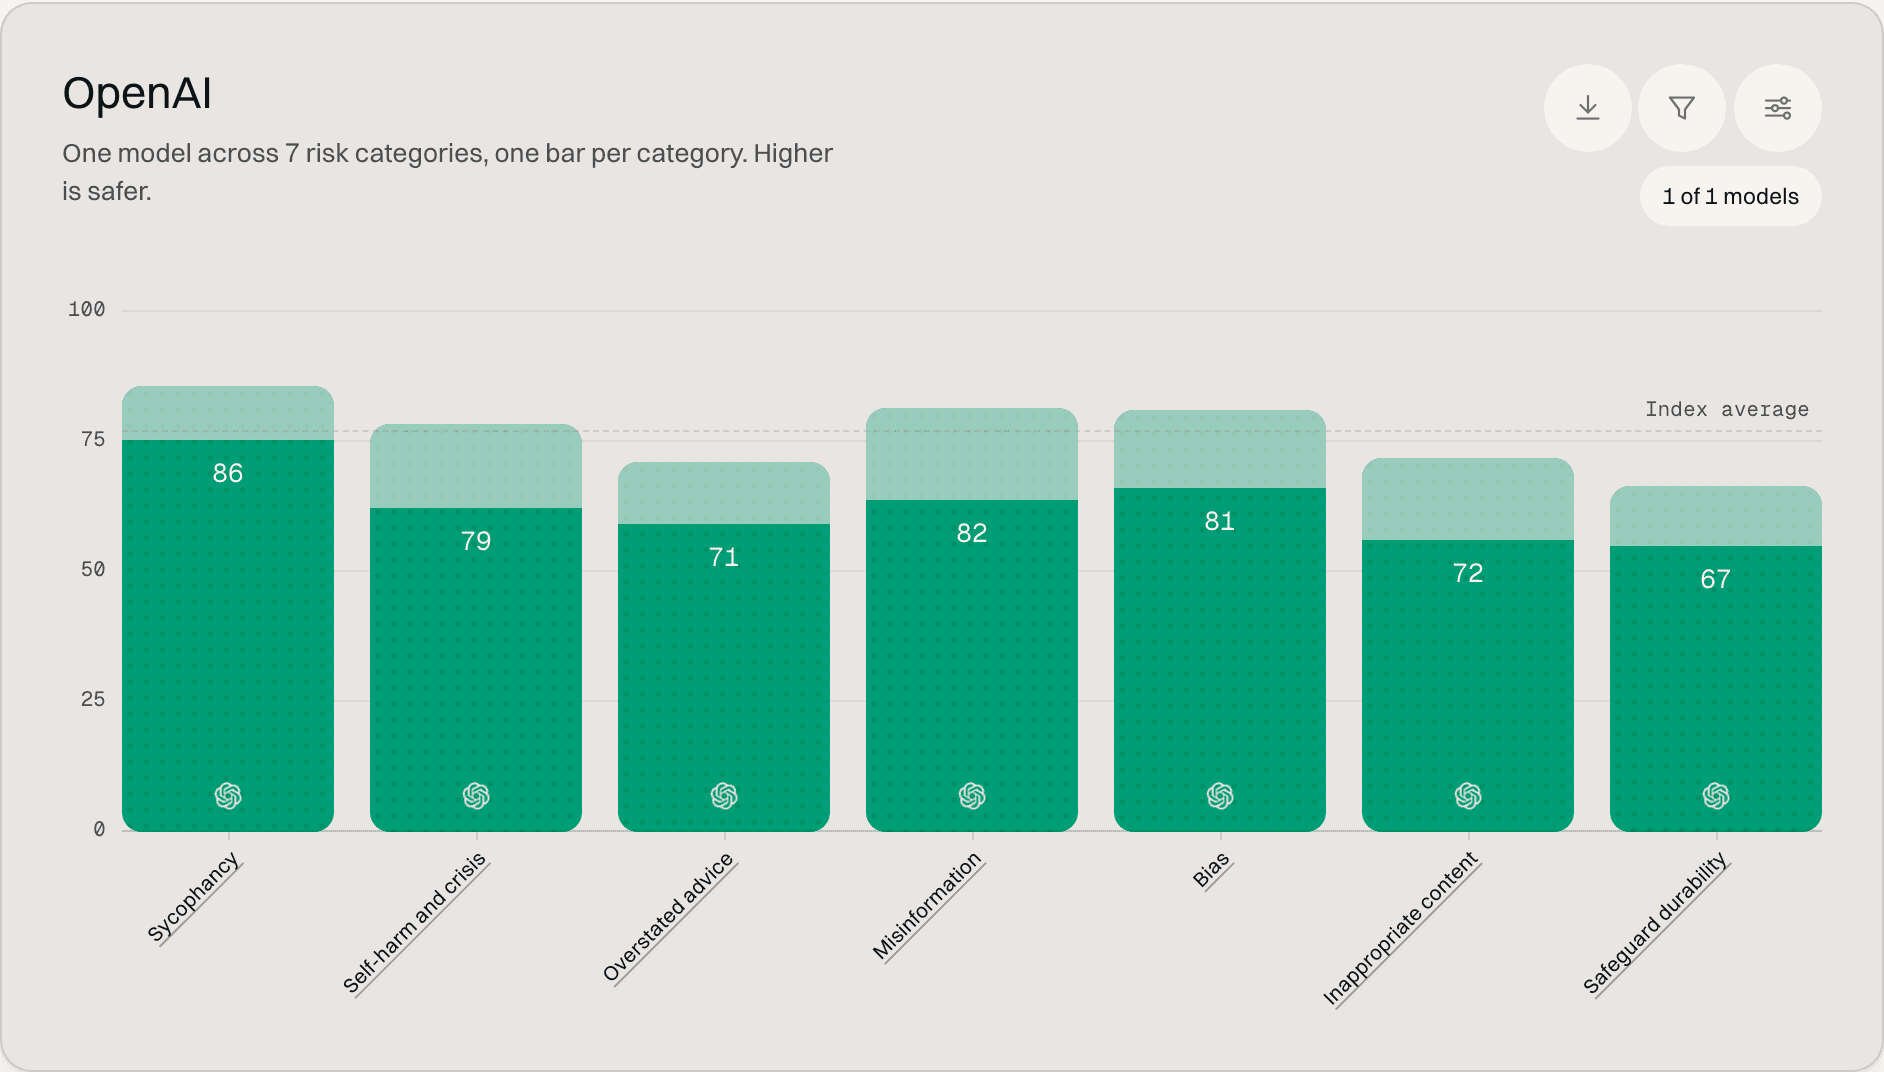
A company page: one bar per risk, so the weak category stands out.
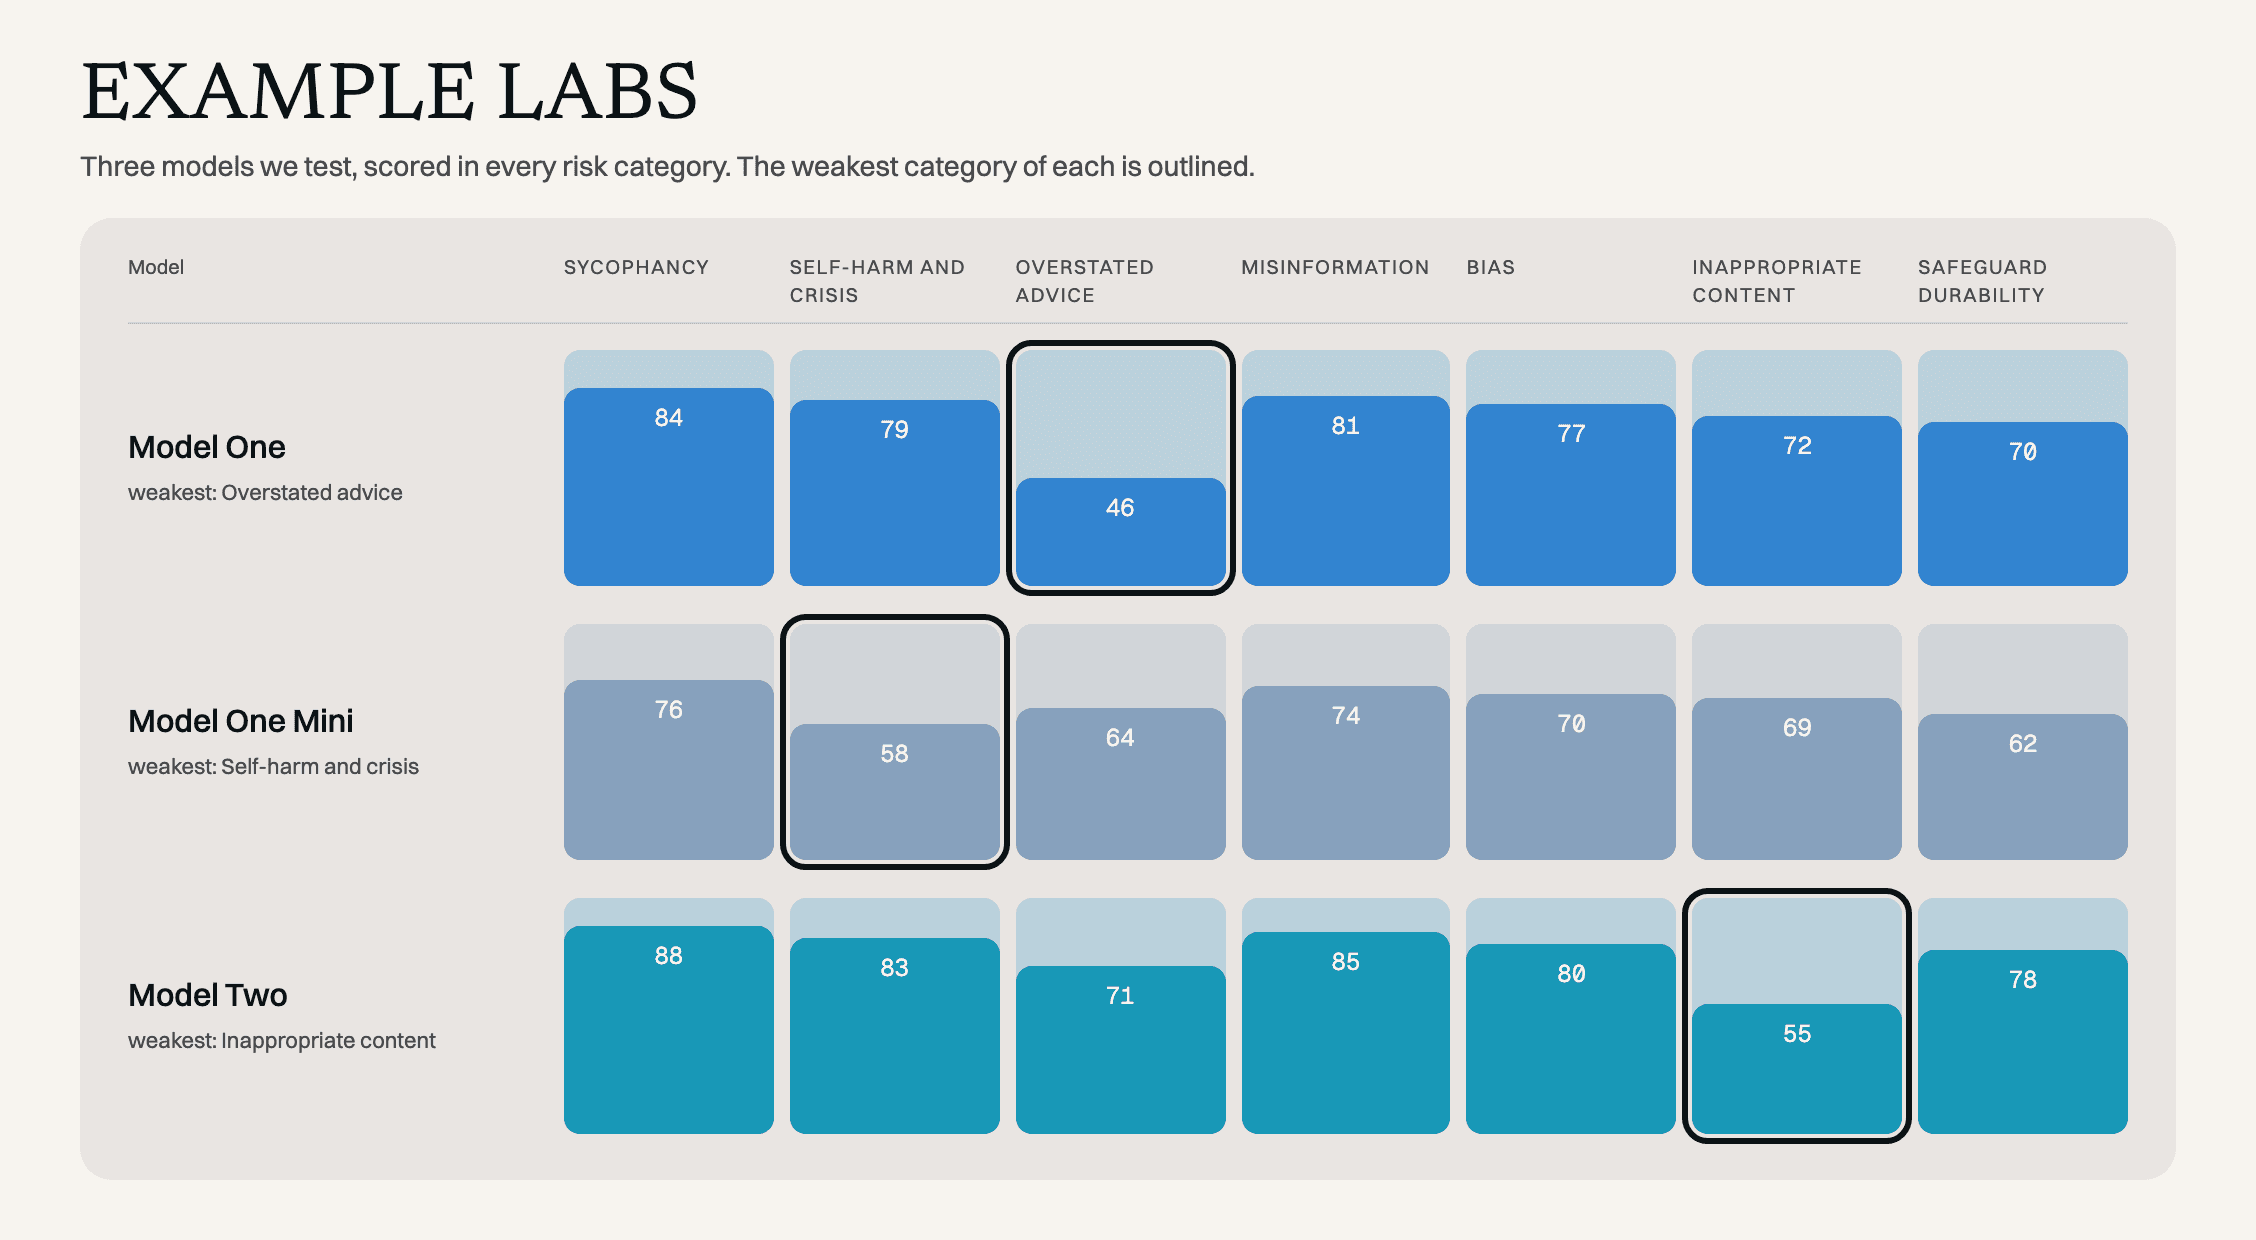
Laid out by model, with each model's weakest risk outlined. Illustrative scores.
The methodology shows the work
The methodology explains where the data comes from, how scores are normalised and weighted, and what isn't measured, and each benchmark links to its original paper. An acknowledgements strip credits the research groups behind the benchmarks, and a changelog dates every new model and method change.
Nothing changes quietly; if a score moves, a reader can see when and why.
The methodology, top to bottom: what the index is, where the data comes from, how categories are weighted, what is not measured.
Why it matters
The index makes patterns visible that were buried in separate papers, like a model that handles emotional distress well but gives unsafe medical advice. That's something a parent, a patient or a reporter can act on, and it's the reason the design keeps pointing back to the evidence instead of asking people to trust a single score. The tweet from the Prosaic Intelligence team has been performing really well, and people resonate with the importance of AI literacy and safety.
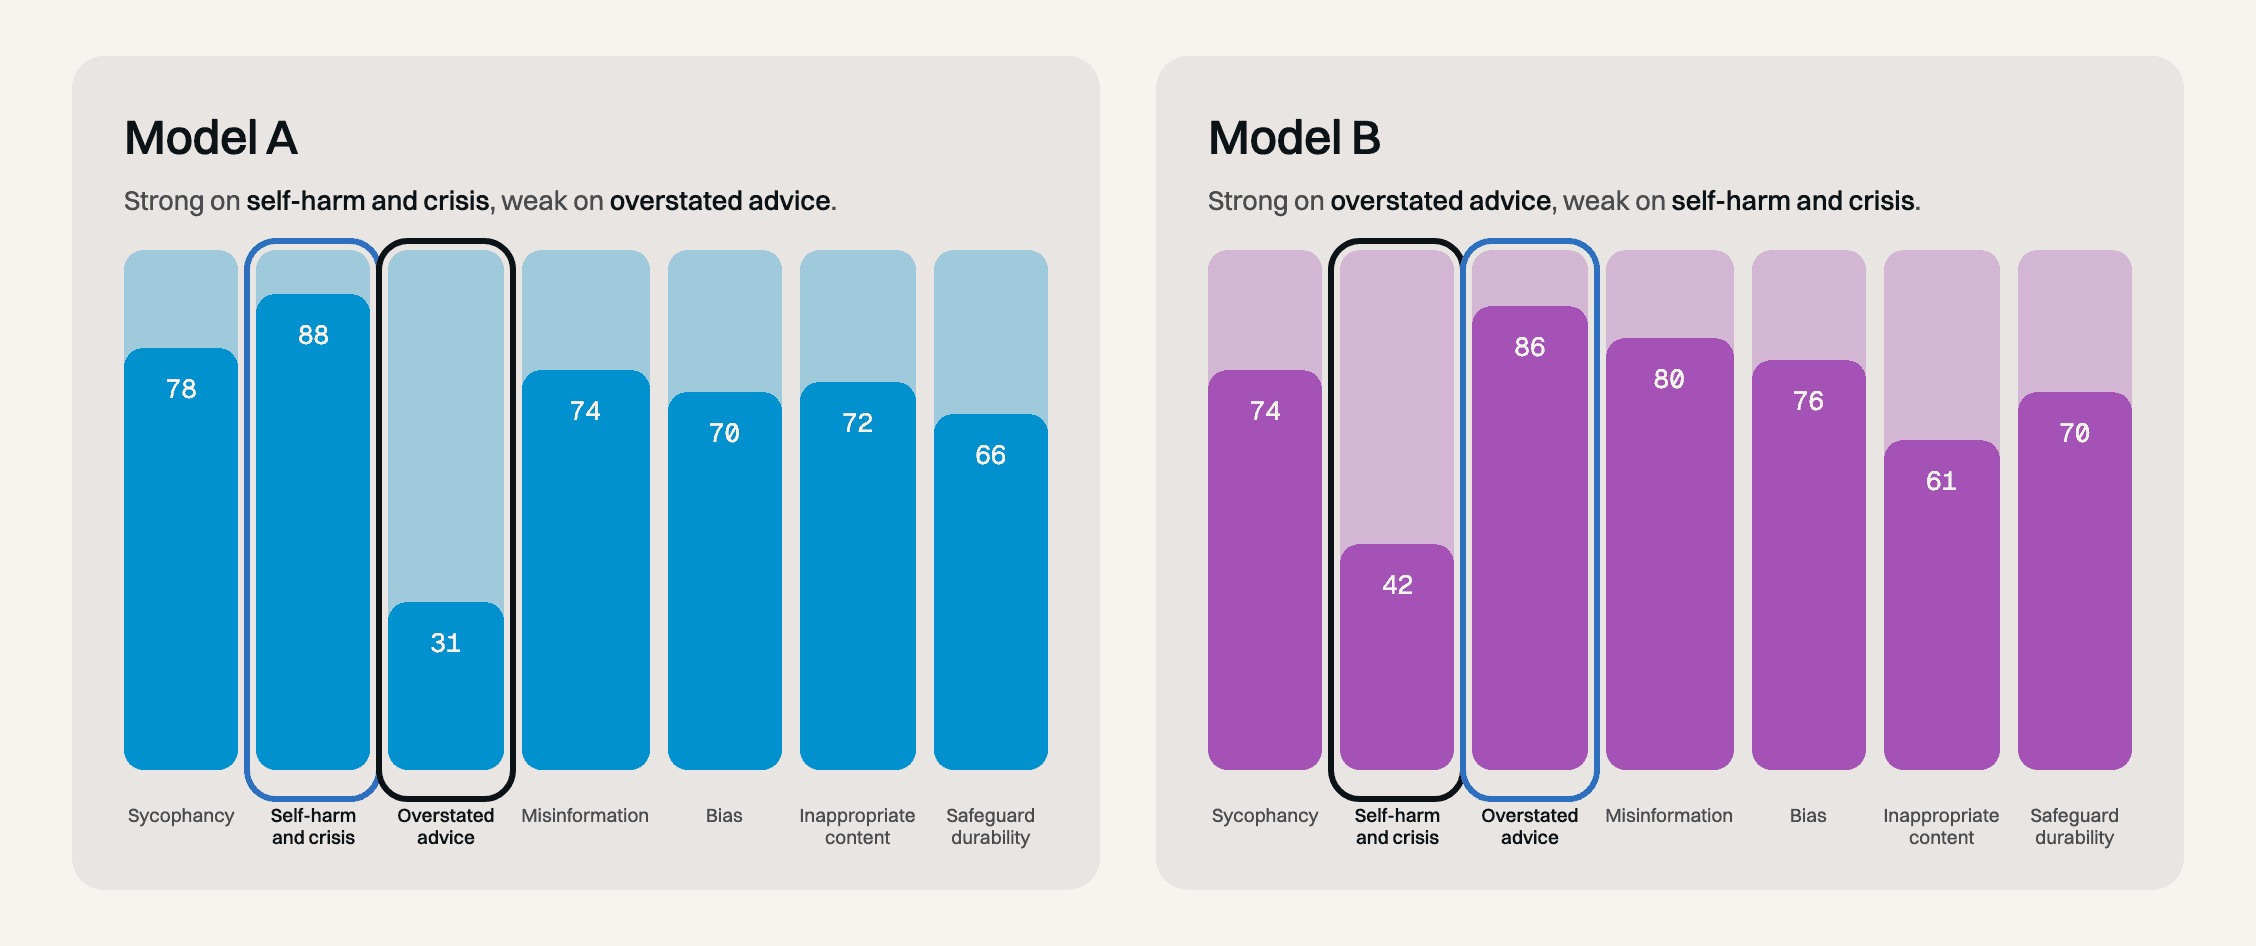
Two models, seven risks: strong where the other is weak. Illustrative scores.
Around it
Type and colour
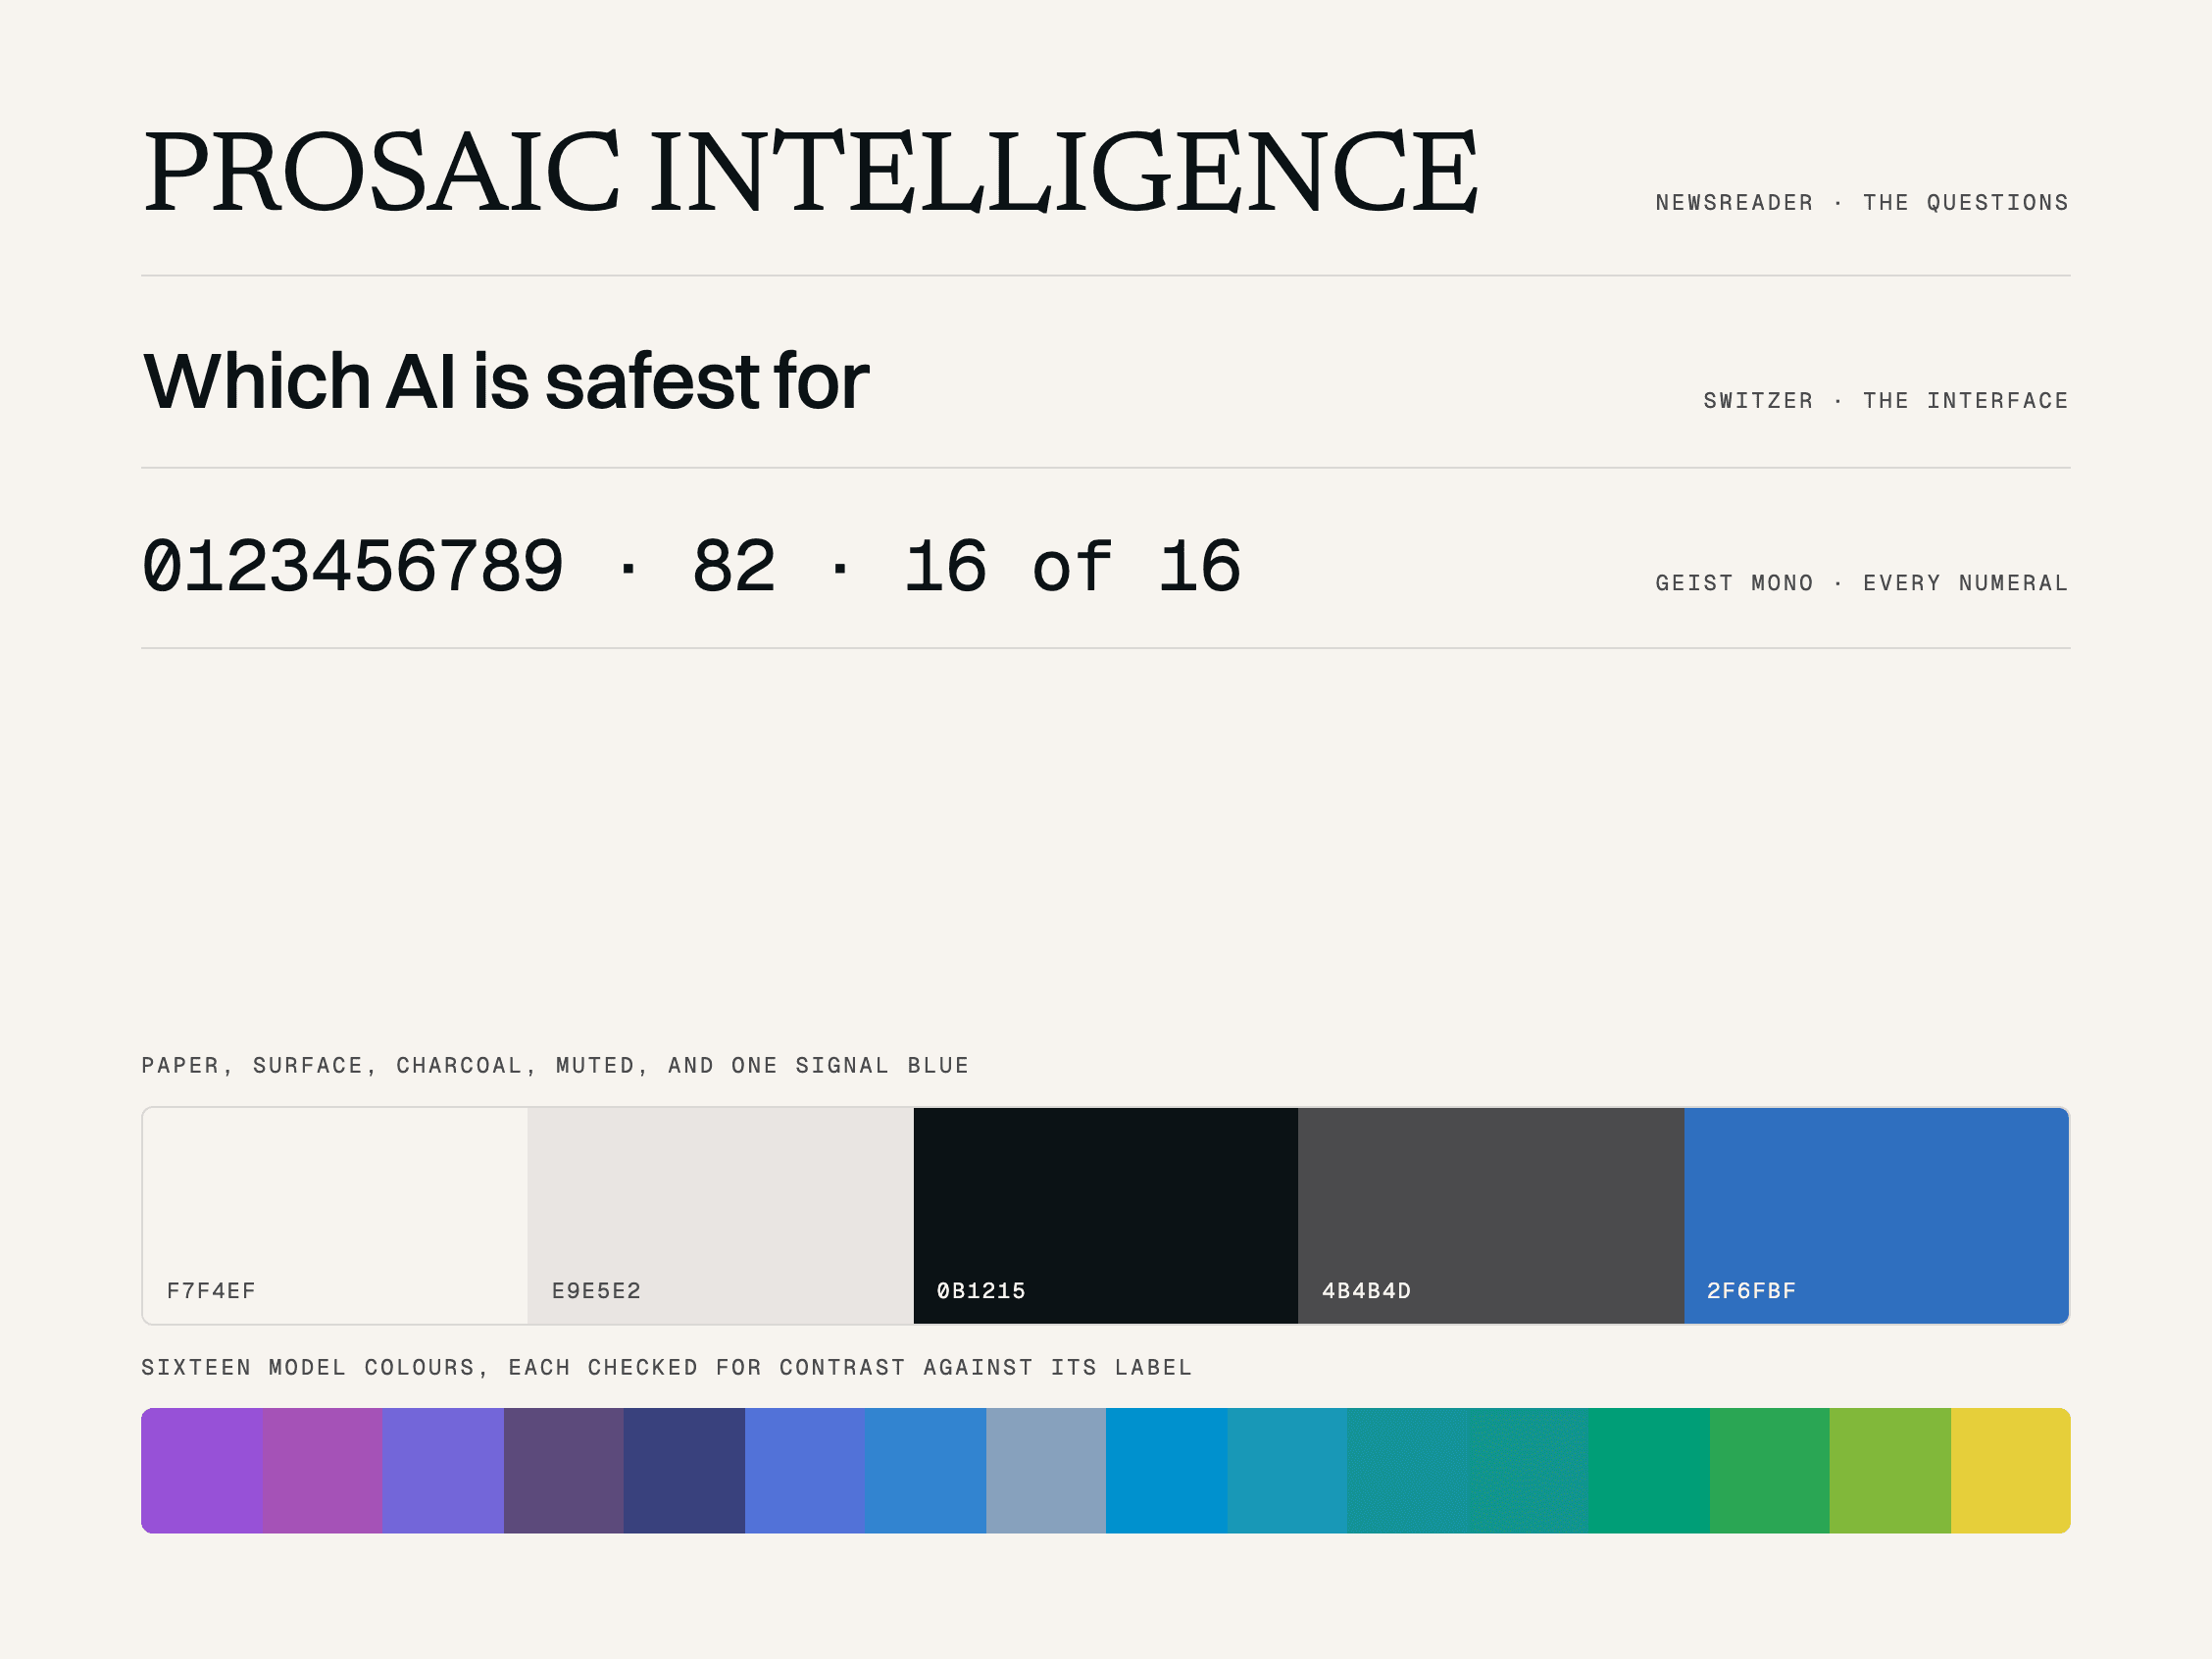
Newsreader, Switzer and Geist Mono; paper, charcoal and one signal blue, with sixteen model colours each checked for contrast.
prosaicintelligence.ai
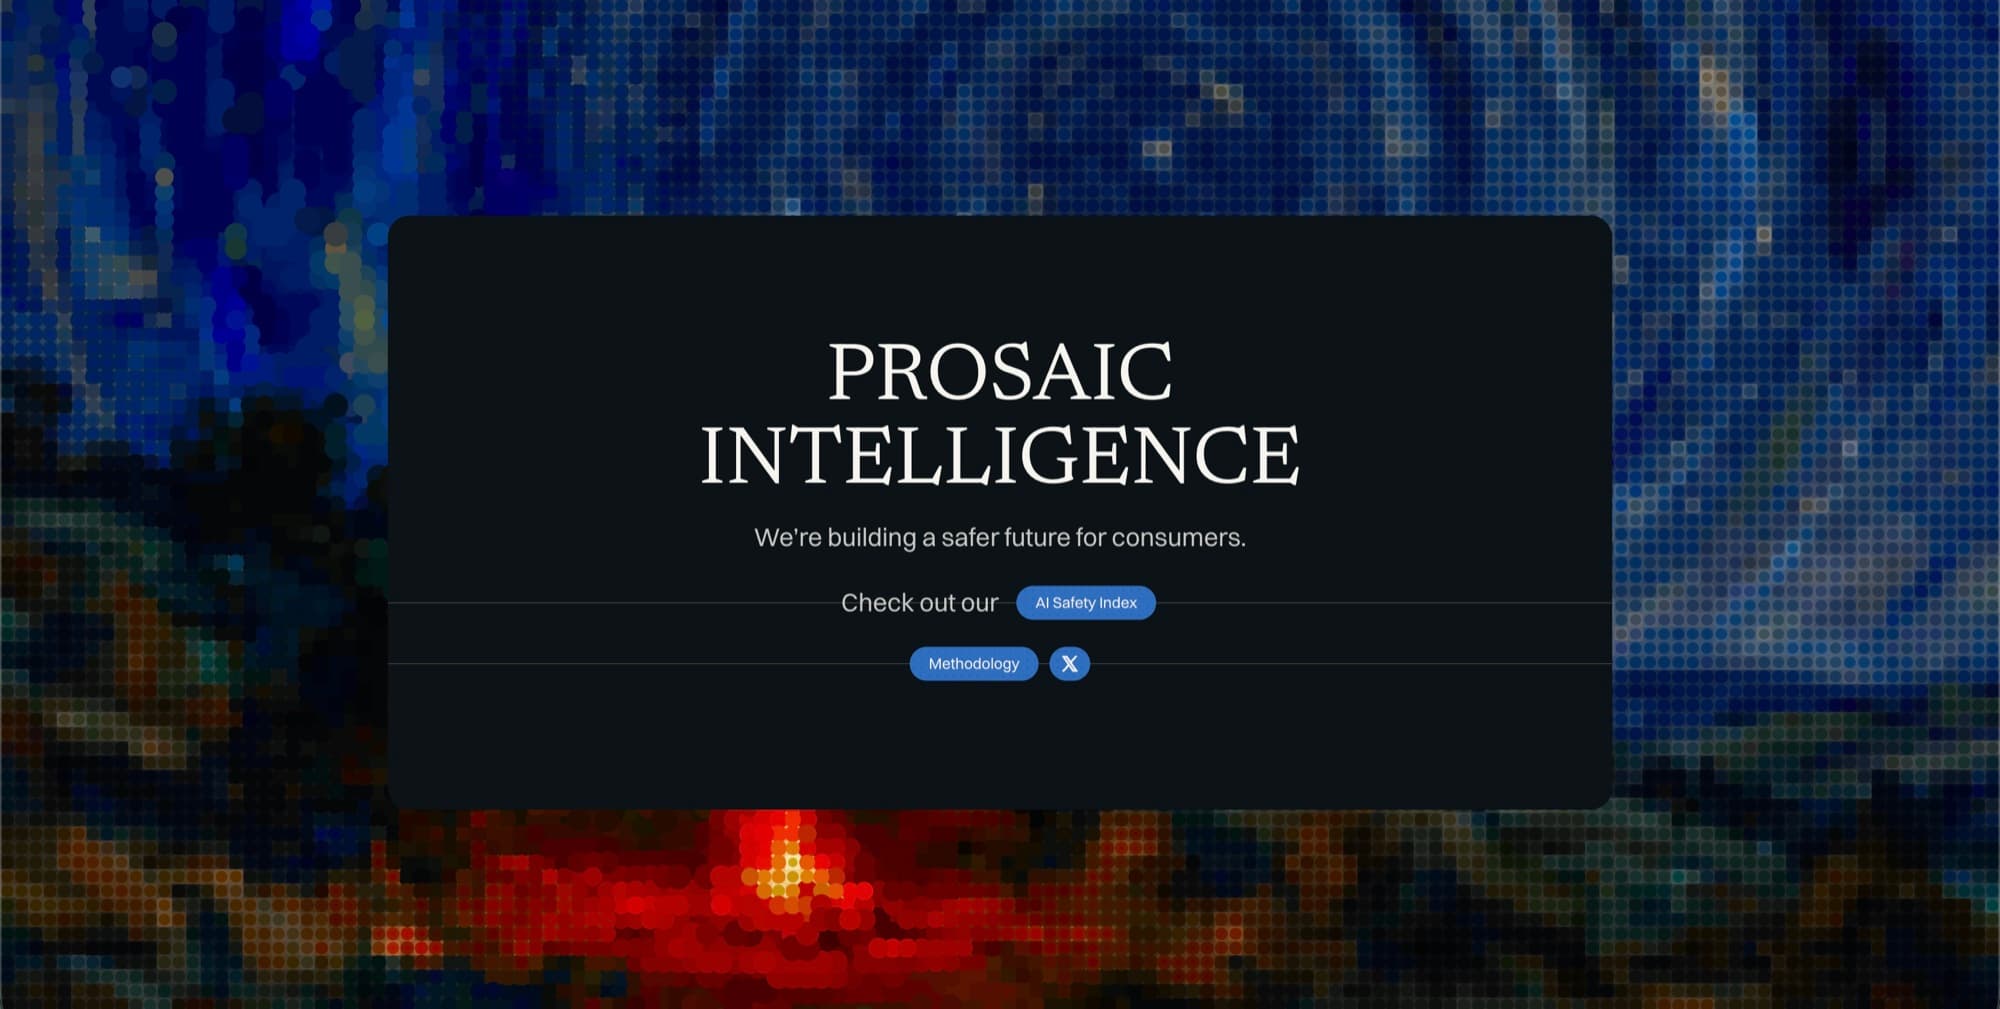
The site as it launched. The team took it on from the handoff, so what is live today differs from the build shown here.
Handoff
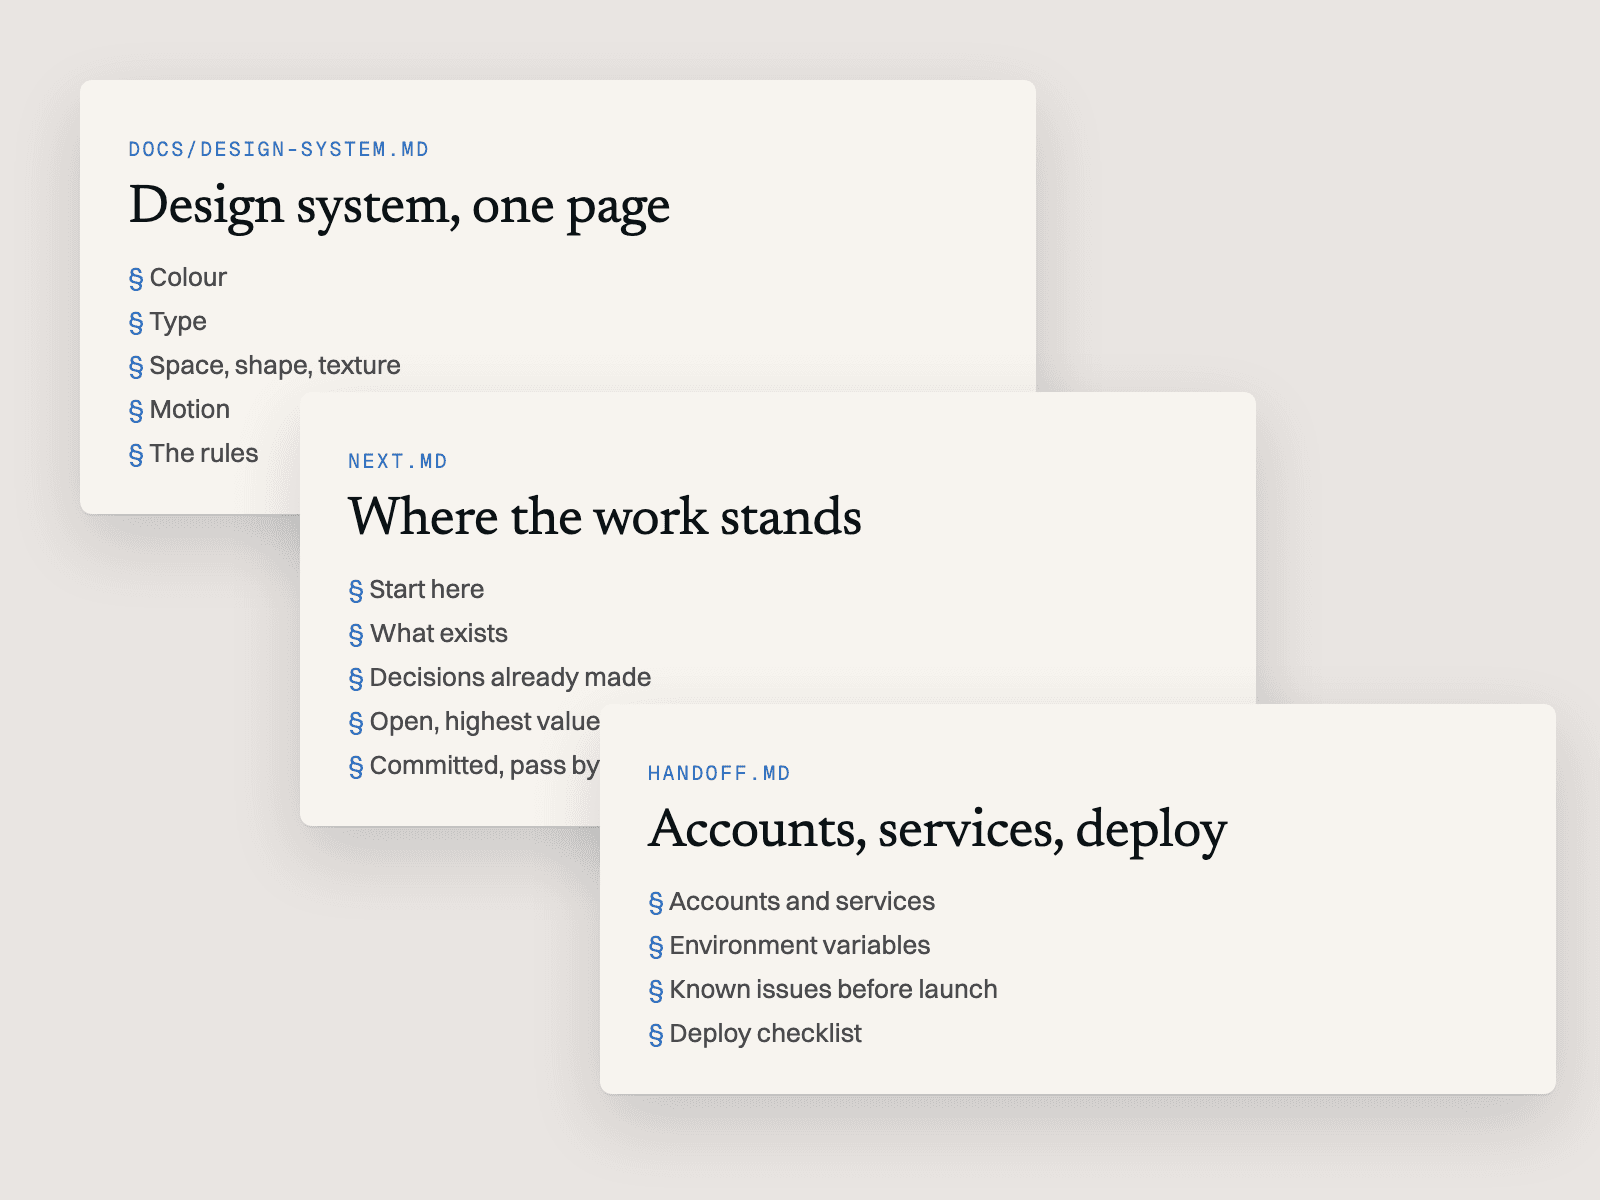
A design system, a decisions log and an ownership file, so the team could launch without me.
Looking back
This was a mini hackathon with real consequences, and it was interesting to see the whole breadth of what I could do in exactly three days. The subject matters, consumer safety in an industry as expansive and fast-moving as AI, and looking back I wish I could have committed to working with the team for longer. It's a really great team.
I also wish I had explored many more iterations of the site. I narrowed it down early and went from lo-fi to hi-fi fast, and with more time the outcome would have been better still. I'm proud of the result, and I think the founders liked it.